Aviation alternative-fuels math: Boeing's Q1 2026 delivery recovery made the fuel calculus harder.
TL;DR [show]
An operator-tier update on sustainable aviation fuel economics two years into the 2024 mandate ramp. Production capacity has grown but remains far short of the blending mandates' implied demand. The price differential to conventional jet fuel has narrowed but not closed. The blending limits at the engine and infrastructure level constrain how much SAF a route can actually carry. And Boeing's Q1 2026 delivery recovery, which the trade press read as good news for the carriers, has worsened the fuel-mix economics for the operators receiving the new aircraft. Long retrospective-update walking the production picture, the price picture, the blending limits, the route-by-route impact, and what the operator-class read on the trajectory should be.
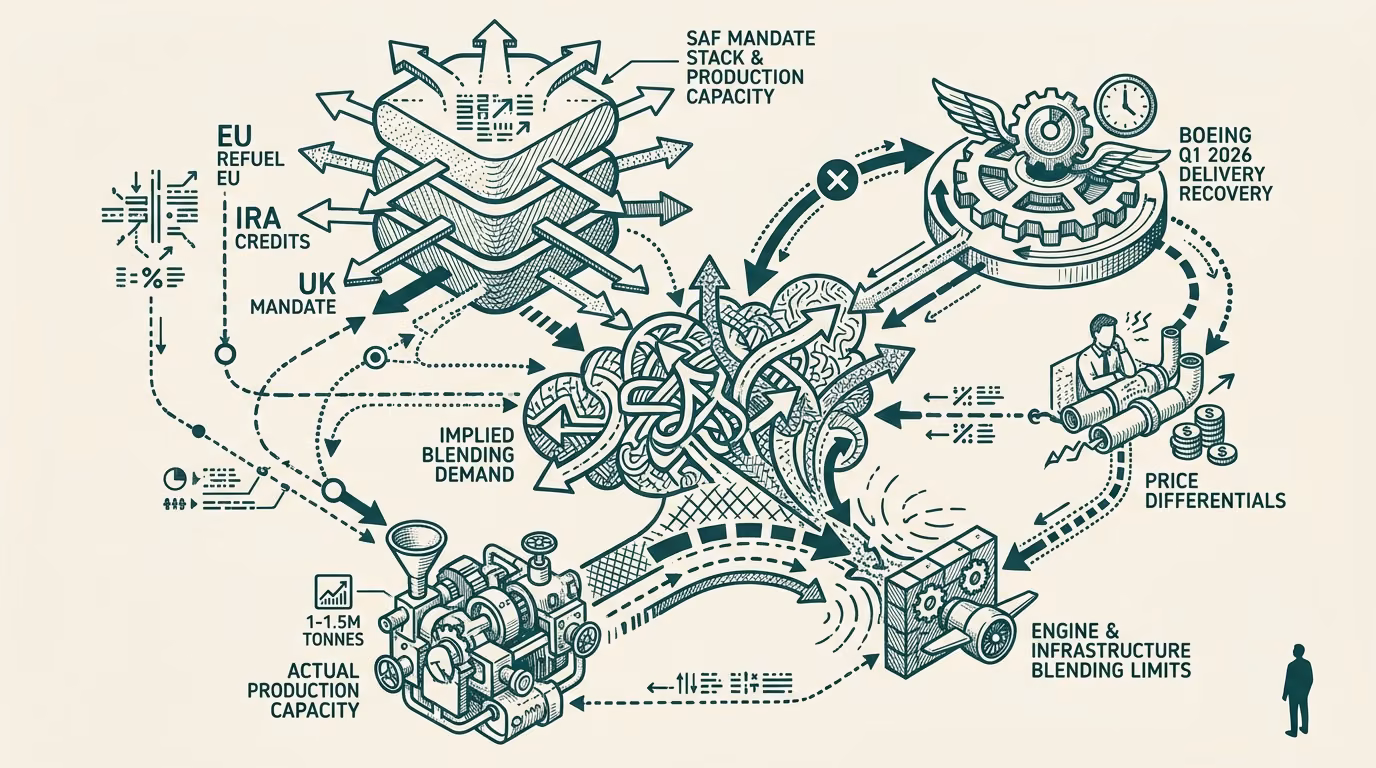
The sustainable aviation fuel mandates that ramped in 2024 (the EU's ReFuelEU Aviation requirements, the U.S. Inflation Reduction Act SAF tax credits, the U.K. SAF Mandate, plus the various voluntary commitments from major carriers and airports) are now two years into operation. The operator-tier read on what has happened in the SAF economics is more nuanced than the trade-press coverage has been running. Production capacity has grown but is still far below the demand the mandates imply. The price differential to conventional jet fuel has narrowed but not closed. The blending limits at the engine and infrastructure level constrain how much SAF any given route can actually carry. And Boeing's Q1 2026 delivery recovery, which the trade press read as good news for the carriers, has actually worsened the fuel-mix economics for the operators receiving the new aircraft, in a way that has not been generally reported.
This is an update piece. The intent is to walk the production picture, the price picture, the blending-limit picture, the route-by-route impact, and what the structural read on the trajectory should be. The numbers are operator-tier rather than advocacy-tier. The piece does not take a position on whether the mandates are the right policy. The piece walks what the numbers actually are.
The production picture
Global SAF production capacity in 2024 ran at roughly 1-1.5 million tonnes annually, against a global jet-fuel consumption of approximately 300 million tonnes. The capacity was concentrated in a small number of facilities, primarily Neste's Singapore and Rotterdam refineries, with smaller contributions from World Energy in Los Angeles, the SkyNRG-Shell partnership facilities, and a handful of specialty producers in Europe.
Production capacity in early 2026 has grown to approximately 2.5-3.5 million tonnes annually, with the bulk of the growth coming from Neste's continued expansion, the LanzaJet Freedom Pines facility, the Honeywell-and-Petixa partnerships in Europe, and several Chinese state-owned refining additions. The growth is meaningful but is significantly behind the mandated-demand trajectory. The EU's ReFuelEU Aviation 2030 milestone (6 percent SAF blending across EU departures) implies EU-only demand of roughly 4-5 million tonnes annually, and the EU is one of several mandate jurisdictions.
The structural problem is that the production-capacity expansion runs on a multi-year capital-deployment cycle (typically 3-5 years from final-investment-decision to operating capacity) while the mandate trajectory ramps faster than the capital cycle can keep up with. The 2026 production capacity has been determined largely by 2021-2023 investment decisions. The 2030 production capacity is being determined now. The structural read is that the 2027-2029 production capacity is going to remain materially below mandate demand, with the gap covered through some combination of compliance flexibility, sub-target compliance, and market-based mechanisms (BECCS-class credits, book-and-claim arrangements) that the carriers and refiners are negotiating against the regulator's evolving posture.
The price picture
SAF in 2024 priced at roughly 2.5-4x conventional jet fuel, depending on the feedstock pathway and the geography. The price differential was the largest single barrier to voluntary uptake by carriers beyond the mandated minimums.
The 2026 price differential has narrowed to roughly 1.8-2.8x, again depending on pathway and geography. The narrowing is partly from production-cost reductions as the new facilities reach scale, partly from feedstock-supply expansion (used cooking oil, agricultural residues, and the early-stage power-to-liquid synthesis pathways), and partly from the U.S. tax-credit structure under the Inflation Reduction Act, which has subsidized U.S.-produced SAF in a way that has compressed the market price the carriers see at U.S. airports.
The price differential remains substantial enough that voluntary SAF uptake beyond mandate minimums has been limited to airline-class commitments where the carriers have made strategic-positioning bets that absorb the price differential as a marketing-and-emissions-reporting investment. Major carriers running visible SAF programs (Lufthansa Group, IAG, United, Delta on selected routes) have absorbed the cost as roughly 0.5-1.5 percent of their fuel-cost line, depending on the size of the program. The cost is meaningful but not crippling at this scale.
The durable read is that the price differential closes further over the next 36 months but does not reach parity within the operator-class planning horizon. The 2030 SAF price is likely still 1.3-1.8x conventional jet fuel under most production-pathway scenarios, with the differential being structural rather than transient.
The blending limits
The blending limits are the part of the SAF picture the trade-press coverage has been generally not surfacing in operator-relevant detail. The current commercial-aviation engine certification permits SAF blending at up to 50 percent of the fuel mix, with a few specialty engine configurations certified for higher percentages. The certification limit is a function of the engine's tolerance for the specific aromatic-and-sulfur composition profile of the SAF blend.
The infrastructure-side blending limits are also relevant. Airport fuel-handling systems, pipeline-and-storage infrastructure, and the multi-supplier blending operations at the major hub airports were designed for conventional jet fuel and have been progressively retrofitted to handle SAF blends. The retrofit work is ongoing and the infrastructure-side blending limit at most major airports is below the 50 percent engine-certification limit, in many cases substantially below.
The operational impact is that the maximum SAF percentage a flight can actually carry is the lower of the engine certification limit, the airport infrastructure limit, the supply availability at that airport, and the carrier's operational-and-cost decision about how much SAF to take. The combined limit is typically 5-25 percent at the better-equipped airports and substantially lower at the rest. The 50 percent engine-certification ceiling is rarely the binding constraint. The infrastructure-side bottlenecks are more often the binding ones.
The implication is that even with adequate SAF supply and acceptable price, the maximum SAF blending a route can carry is constrained by airport-side infrastructure that is being retrofitted on a multi-year timeline. The 2026 average SAF blending across global flights remains in the low single digits despite the mandate trajectory and the carrier-class voluntary commitments.
The route-by-route impact
The route-by-route impact varies substantially. Routes between major European hubs (Frankfurt, Amsterdam, Heathrow, Paris-CDG) carry SAF blends in the 5-12 percent range for some carriers, reflecting both supply availability at those airports and the EU mandate compliance trajectory. Routes between U.S. hubs and EU destinations carry SAF blends primarily on the EU-departure side (because the EU mandate applies to EU-departing flights), with the U.S.-departing side typically carrying conventional jet fuel except for the carriers running specific SAF commitments at U.S. hubs.
Routes operating in regions without binding mandates (most of Asia-Pacific outside the U.K. and Singapore, most of Latin America, most of Africa) typically carry conventional jet fuel without meaningful SAF blending. The supply infrastructure at these airports is largely not retrofitted, the price differential is not subsidized, and the carrier commitments do not generally apply to these routes.
The result is that the global SAF picture in 2026 is geographically concentrated in Europe and selected U.S. routes, with the rest of the world running on conventional jet fuel for the foreseeable mandate-and-supply horizon.
The Boeing delivery recovery wrinkle
The Boeing Q1 2026 delivery recovery, which the trade press read as broadly good news for the carriers (because the carriers needed the new aircraft to refresh their fleets and increase capacity), has had a less-discussed implication for the SAF economics. The new Boeing aircraft delivered in Q1 2026 (737 MAX, 787, 777-300ER replacements) are more fuel-efficient per seat-mile than the aircraft they are replacing. The fuel-efficiency improvement reduces the absolute fuel consumption per route, which in turn reduces the absolute amount of SAF blending required to hit a given percentage-blending target.
This is operationally helpful for the carriers running mandate compliance. It is also operationally a problem for the SAF market dynamics. The reduced fuel consumption per seat-mile means that the demand growth for SAF that the mandate trajectories implied has been somewhat moderated by the fuel-efficiency improvement. Combined with the production-capacity ramp running behind, the result is a slightly less-acute supply-demand imbalance than the 2024 modeling implied, but also slightly less margin for the SAF producers, which slows the capital-deployment cycle for the next tranche of production capacity.
The trade-press story has not run the second-order effect. The carriers reading the SAF supply curve and the Boeing-delivery curve together are running it carefully, because the two interact in ways that the simple mandate-compliance modeling does not capture.
What the operator class should take from this
The durable read on SAF in 2026 is that the trajectory is working in the directions the mandates intended, on a slower timeline and at higher cost than the optimistic 2024 modeling implied. Production is ramping but lagging. Prices are narrowing but not closing. Blending limits constrain the per-route maximum below the engine-certification ceiling. Geographic concentration is real and persistent. The Boeing delivery recovery has secondary effects on the SAF demand curve that the trade press has not surfaced.
For carriers, the practical advice is to plan SAF compliance against the lower end of the production-and-infrastructure scenarios rather than the upper end. For airports, the practical advice is to accelerate the infrastructure retrofit work because that is becoming the binding constraint at more airports faster than the 2024 forecasts implied. For the policy-class running the mandate evolution, the practical advice is that the production-and-infrastructure ramps are not on track to support the 2030-2035 mandate trajectories, and the policy-side instruments (additional credits, sub-target compliance flexibility, book-and-claim mechanisms) need to accommodate that gap.
The trajectory is moving. The trajectory is also slower than the optimistic case predicted, and the operator class running the math carefully is positioning for the more constrained version of the next decade. That is not advocacy. That is the operator-level read on what the numbers say.
—TJ